
The Pimoroni Enviro+ sensors arrived, and they were really easy to setup and get started which is always nice. Because I had a Raspberry Pi A+ laying around from a previous project I decided to use that instead of buying a new W. Unfortunately the clearance to the USB port isn’t quite enough, so I had to use a header riser to clear it.
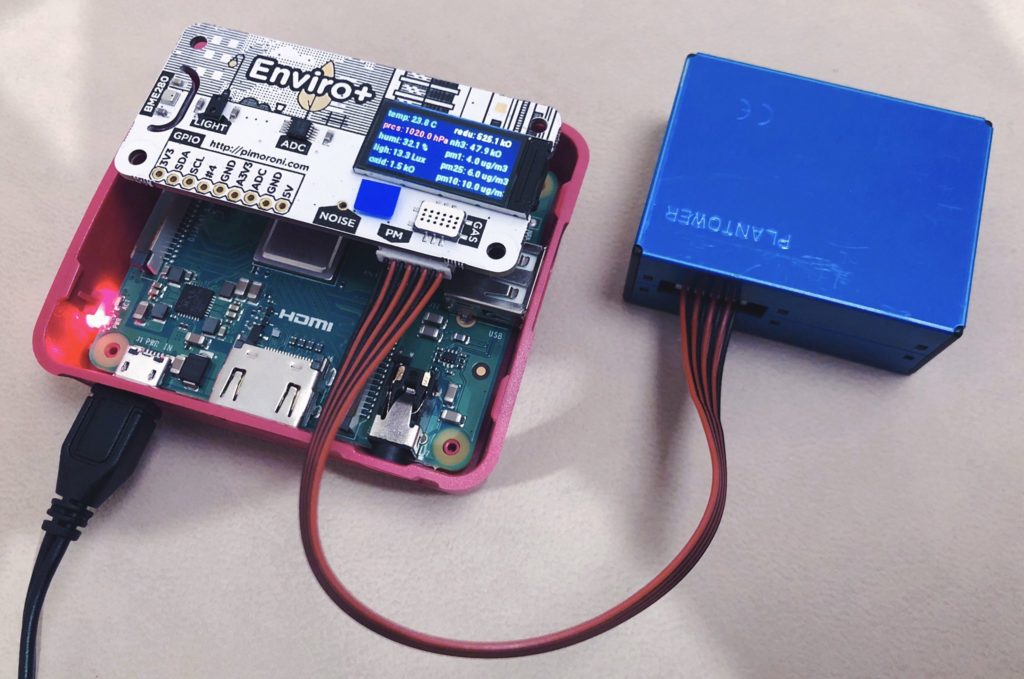
After assembly I started with the basics using a Raspbian image to test out the Pimoroni sample code following their excellent tutorial. The output from the all-in-one.py script was pretty noise free and consistent. The only bug I hit was that on first boot I occasionally had to run the script twice to get the PMS5003 sensor to return values. Here’s a sample of the sensor data available:
2020-03-11 12:16:33.346 INFO pm1: 4.0 ug/m3
2020-03-11 12:16:33.347 INFO pm25: 6.0 ug/m3
2020-03-11 12:16:33.348 INFO pm10: 10.0 ug/m3
2020-03-11 12:16:33.455 INFO temp: 23.8 C
2020-03-11 12:16:33.509 INFO pres: 1020.0 hPa
2020-03-11 12:16:33.562 INFO humi: 32.1 %
2020-03-11 12:16:33.570 INFO ligh: 13.3 Lux
2020-03-11 12:16:33.660 INFO oxid: 1.5 kO - nitrogen dioxide (oxidising)
2020-03-11 12:16:33.661 INFO redu: 525.1 kO - carbon monoxide (reducing)
2020-03-11 12:16:33.661 INFO nh3: 47.9 kO - ammonia (NH3)
My next step was to get Prometheus (software to store the sensor data) and Grafana (software to graph that data visually) installed and running so I could visualise what it looked like. Because I didn’t have a dedicated local server to run it on and wanted to containerise the software (with Docker) in the long run, I decided to set it up on the Raspberry Pi.
A couple of searches found a nice project to base it off of by Sven A. Schmidt. I modified the Dockerfile to point to armv7 images for the Pi, and ended up with a nice multi-container docker-compose that will also work well with Balena (software to deploy lots of Raspberry Pis) in the future.
The only trick to get that up and running was pointing Grafana at the Prometheus data-source address: http://prometheus:9090 to start graphing data.
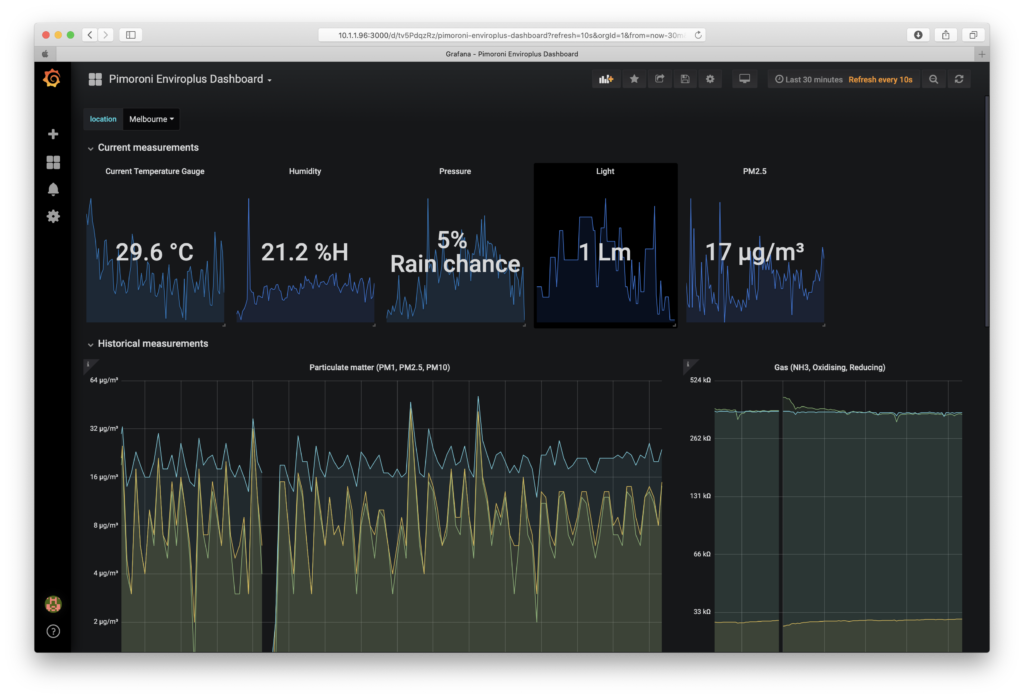
Next I needed to get a Prometheus data exporter to expose the Enviro+ data. Open Source projects are so great, because another search and I came across Tymen’s Enviro+ exporter! He didn’t have the PMS5003 sensor, so I put in a pull-request to add that feature. 🖤 Tymen also had a really great Grafana dashboard setup, so here’s what the first data looked like:
Thinking of the end goal, it’d be great to containerise the sensor code – and again the Open Source community did most of the work for me! Zane Williamson’s project was even built with Balena in mind, but it’s focus was exporting to Luftdaten, so I forked his code and Git-submoduled in the enviro+ exporter. The outcome, a Docker container running the enviro+ exporter.
The final next step is to pull all of this together into a Balena app and deploy it with a public IP address so you can all access the data and see what it looks like. Stay tuned.
If you’d like to support this project and have the skills to build your own, please purchase a Enviro+ & PMS5003 sensor kit, and then let’s deploy the code to yours remotely so we can compare data.
Else if you’d like to support me purchasing more hardware: paypal.me/simonloffler
Simon has clever clogs!
Looks neat man. 🙂
-W-